
You Don’t Need Microsoft Power BI with Sage Intacct’s Interactive Visual Explorer
Does the world need another acronym? AI, ML, BI – Who cares? The world is changing. And that’s not all.
As the CFO, there’s always some shiny new toy being pitched by the, wait for it – CRO, CTO, CMO & PM. Technology has entered a new frontier, moving from the Age of Information to the Age of Answers.
If you’re like other CFOs, you probably want a good dashboard to monitor KPIs & a tool that lets you visualize data across the firm. A lot of people are familiar with Power BI, but that usually requires a consultant and a bolt on to your current systems.
Sage Intacct‘s Interactive Visual Explorer is a tool built into Sage Intacct that lets you explore all of your data within one system.
Visual Explorer uses the data within your system of record and allows you to create interactive charts and graphs in real-time. You can explore your financial data using a multi-angle and multi-dimensional graphical tool and clearly understand insights at a glance requiring no special skills or IT.
Below we define Interactive Visual Explorer, explain why it is vital to your business, share a few thoughts from current leaders, and provide direction for getting started with it in your company.
Why is the Interactive Visual Explorer Important To Your Business?
- What could you do with extra time in your day, month, quarter, and year?
- What if you no longer had to export data and copy that data into slides for financial presentations?
- What if you could make quicker decisions for your company’s future based on real-time data from the past and present?
With Visual Explorer, you can transform your business plan and make strategic, data-driven decisions with interactive, visual insights into your financials.
Automation and Productivity Highlights Include:
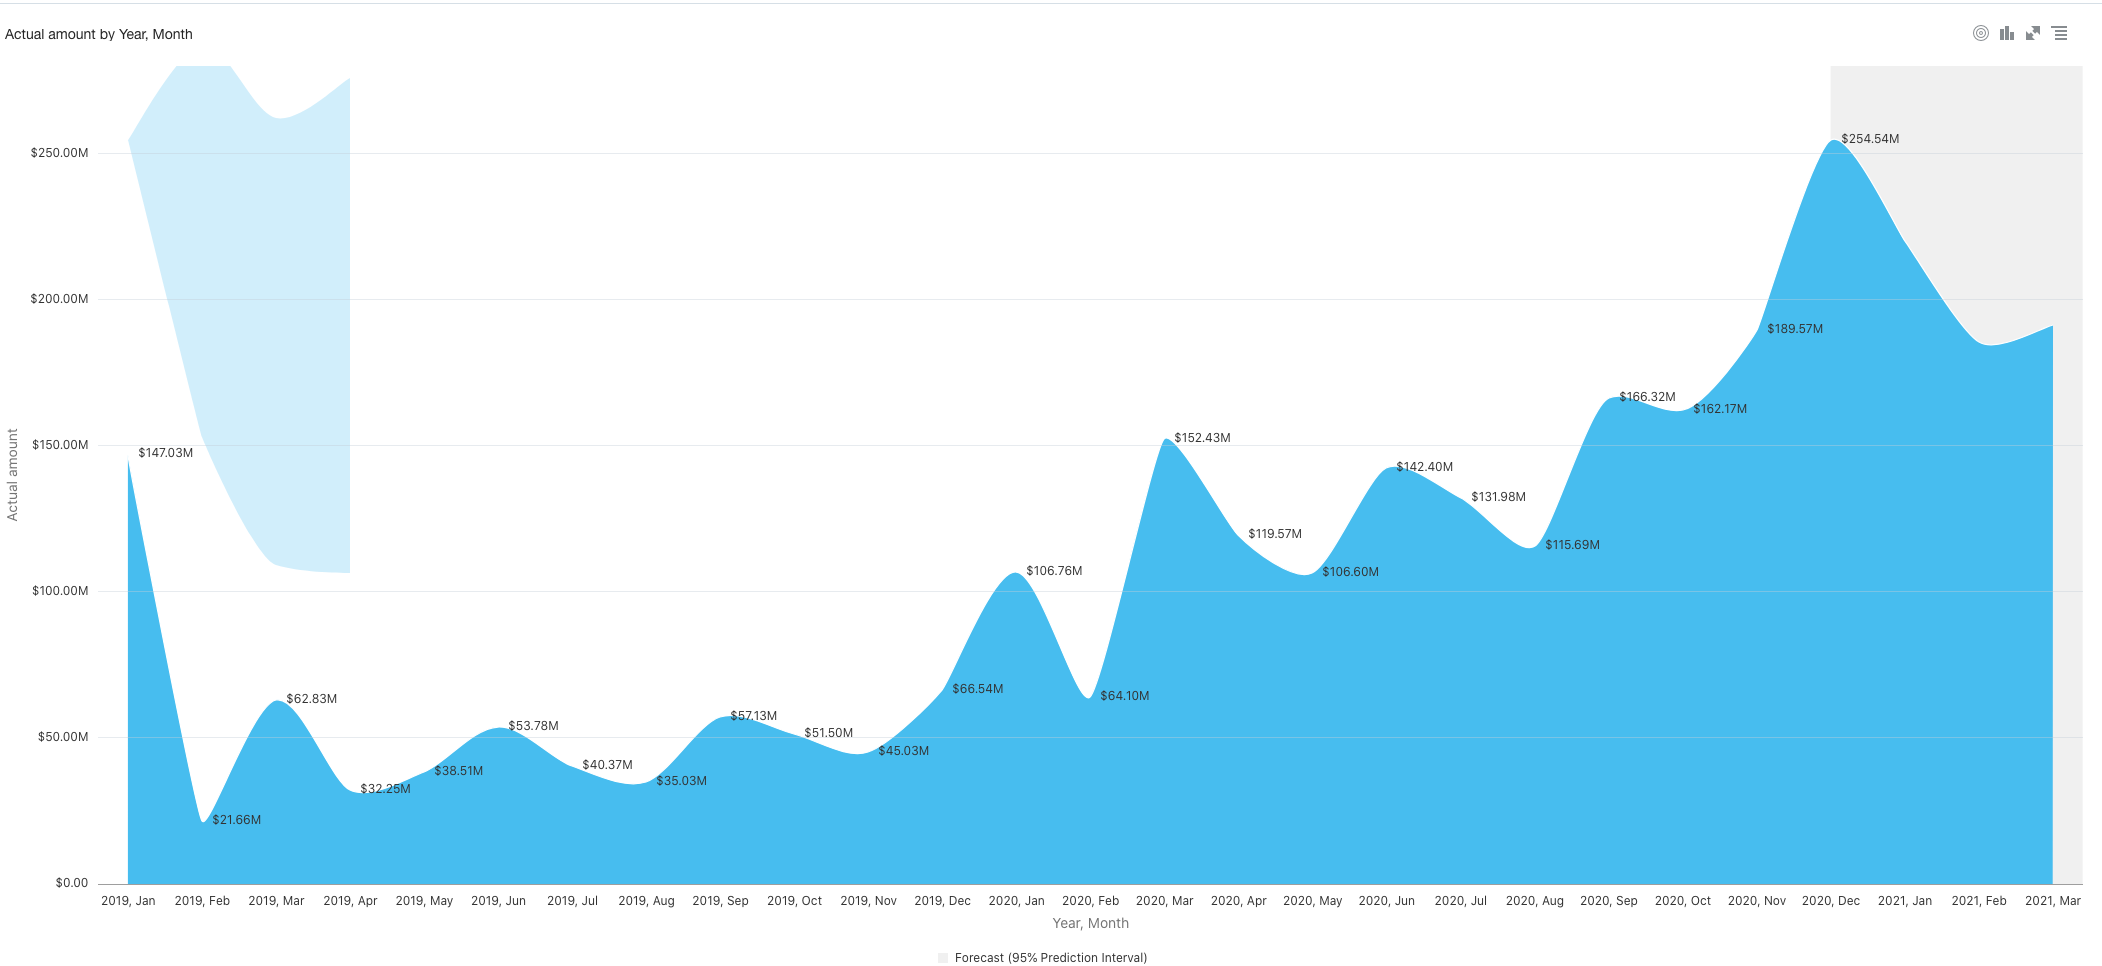
- Create insights with predictive analytics
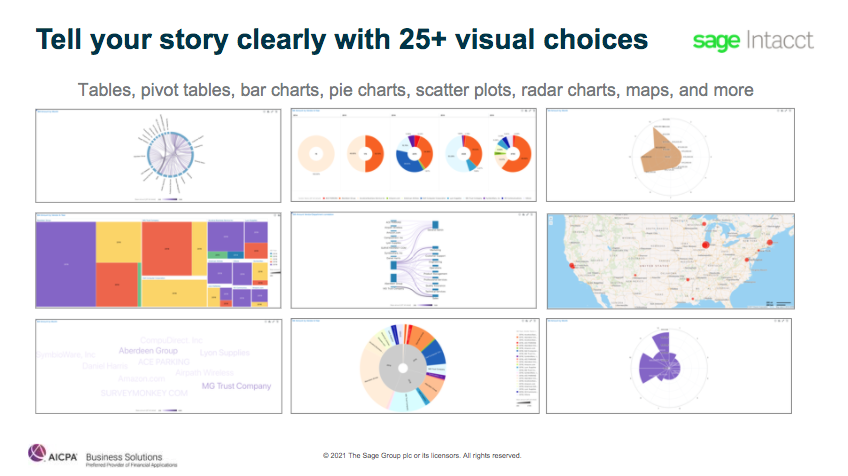
- Use 25+ data visualization types to choose from to best tell your story
- Turn insights into action with visual storytelling and narration
- You don’t need IT resources or a dedicated server
- The 200+ prebuilt visualizations get you up and running fast
So, What Exactly is the Interactive Visual Explorer?
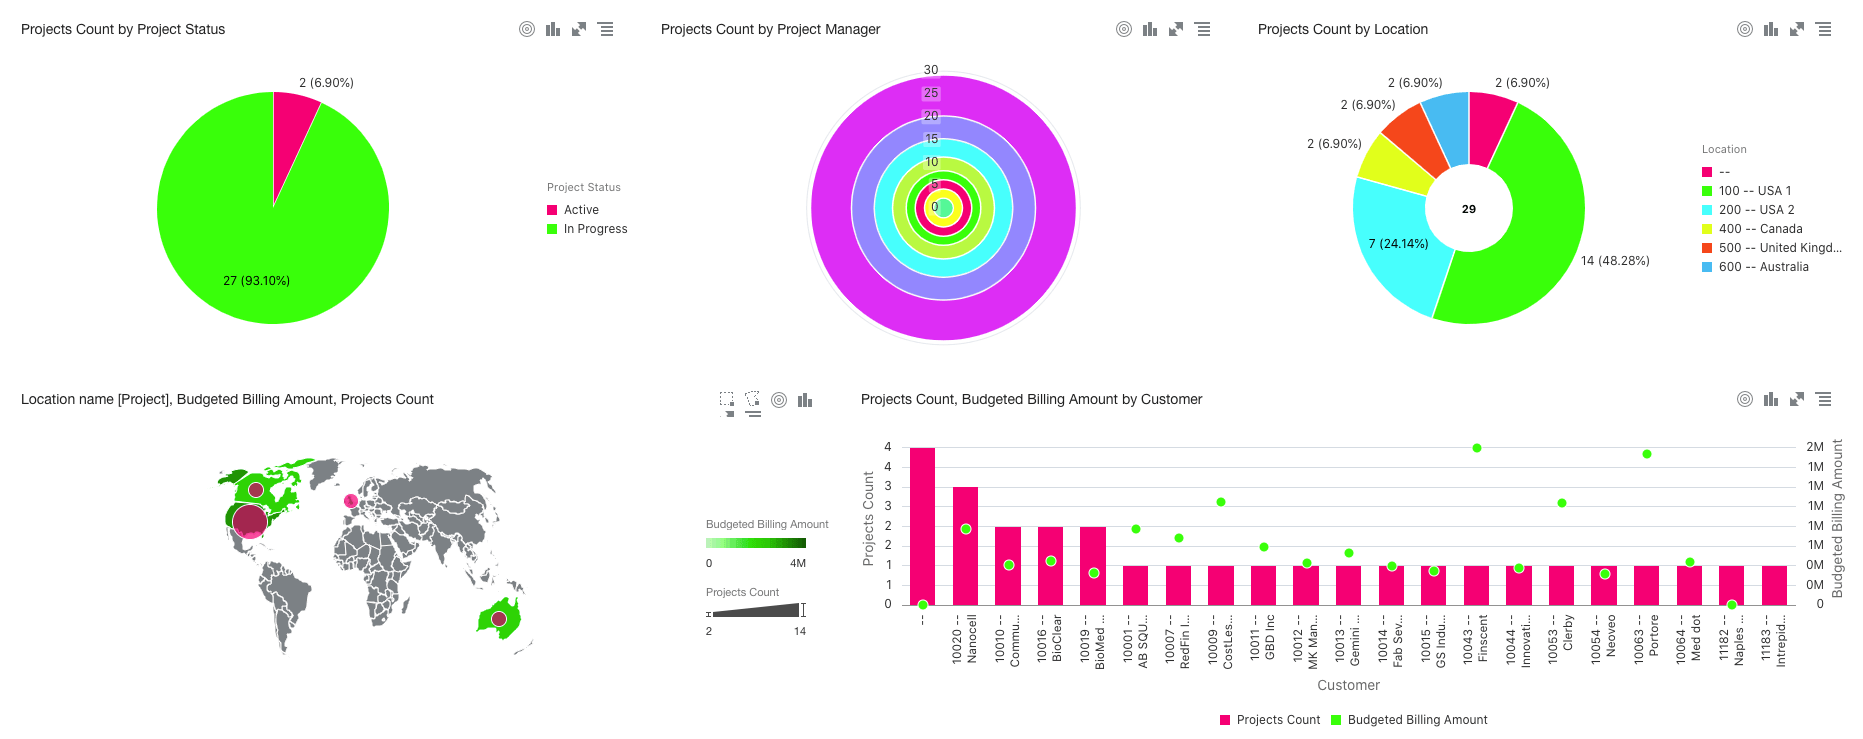
Interactive Visual Explorer is an analytical financial tool built into Sage Intacct that provides a visual story of your company’s data from multiple angles and dimensions. It’s highly interactive, providing 200+ presentation-ready insights. The data is real-time, secure, and can transform your decision-making process. Interactive Visual Explorer empowers you with competitive analysis, quickly turned around insights, predictive and advanced capabilities for the future, and access to more than 25 visuals, including tables, pivot tables, bar charts, pie charts, scatter plots, radar charts, maps, and more!
A picture is worth a thousand words! The Interactive Visual Explorer gives you a collection of pictures!
Why Interactive Visual Explorer (IVE) is Vital to Your Business
Interactive Visual Explorer provides new ways to discover business insights using visualizations. While teams collaborate and explore data using advanced visualizations, each user can add notes to reports using an innovative “narrate” mode to find and capture insights during the analysis right in line with the reporting.
IVE provides:
- Easily digestible insights delivered on-demand. See what just happened, is happening, and can occur in the future
- Transformation of your business so you can free yourself from operational tasks and focus on value-add actions
- Time to analyze insights and strategize on recommendations and steps to achieve your goals
- Intelligent General Ledger
- Freedom for finance teams from repetitive tasks and empowers them with actionable insights
- Working toward eliminating the financial close by automating through integration and intelligence (CRM integrations and AI time entries are examples)
- A daily soft-close so you know the state of your cash
- Outlier transactions are flagged to identify potential errors
What Are Active Users of Interactive Visual Explorer Saying?
Halloran Consulting Group
“We use Sage Intacct Interactive Visual Explorer to manage project resources and utilization as well as to compare budgets. It’s very intuitive. We love that we can quickly navigate between projects and customize graphs on the fly. It replaces Excel for us because it’s more accurate, easier to analyze the information, and more collaborative. We can focus on strategy instead of gathering the data.” – Leanne Malsbury, Associate Director of Finance
J.J. Taylor Companies
“Tells the story of information. Filters very powerful, see data the way preferred, automate time.” – Kristen Jones, Accounting Supervisor
Interactive Visual Explorer is an Easy and Inexpensive Way to Access Insights
The way we do business will continue to change. Today, three things are certain. Leaders of companies are customer-focused, competition is increasing, and business disruptions are escalating. Businesses are more dependant on data for strategizing and making informed decisions for the future. Emerging technology underpins the evolution of the CFO role from historian, to a real-time analyst, to a world where they can strategize with certainty.
With IVE, you’ll gain continuous trust in the numbers, so you don’t have to wait for the close to get that trust. This information flows seamlessly into your reporting and analytics in real-time to provide insights to make the best decisions possible and drive the follow-on actions.
Interactive Visual Explorer Offers:
- A turnkey solution that is inexpensive and requires no special skills or IT
- No data structures to build
- No ETLs (extract, transform, and load) to worry about
- 200+ prebuilt visuals for immediate insight that can be shared internally or externally
- Accessibility from Sage Intacct dashboards
- Uses Sage Intacct Data security
Isn’t It Time For Your Company To Thrive?
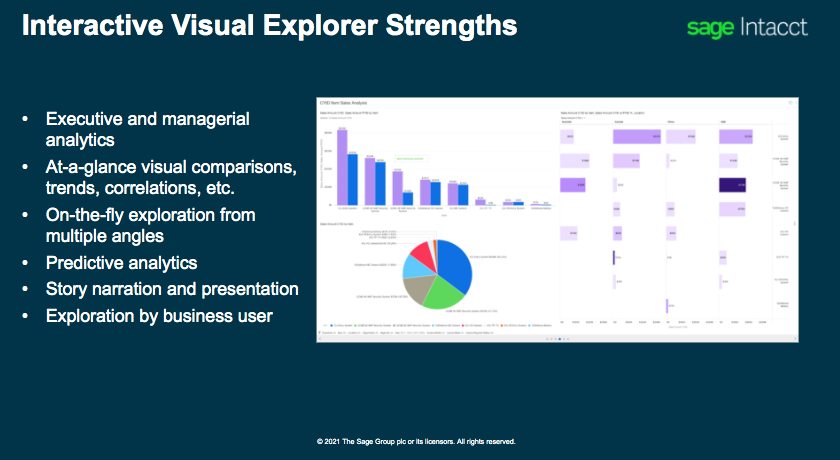
Harness your financial data with Interactive Visual Explorer to save time, gain a competitive edge, and focus on value-add actions. Transform your business strategy with an analytical financial tool that offers at-a-glance insights with visual comparisons, trends, correlations, and so much more.
Are you ready to transform the way you make decisions and watch your company grow?
Contact us or get a more in-depth review of Interactive Visual Explorer by watching Sage Intacct’s on-demand webinar.
Tags
Outgrowing Quickbooks?
Say goodbye to spreadsheet reporting and manual consolidations and start using a cloud-based financial management system.

Related Content

Wrap-Up: Reimagine Your Month-End Close with Sage Intacct

Best Practices to Perfect Your Month-End Close With Sage Intacct

Decoding the Challenges of the Month-End Close

Fast-Track Your Financials: Techniques to Slash Your Month-End Close

Take Control of the Month-End Close: A Checklist for Success
